
See who changed what
Since 0.6 the agent writes down every request that changes something: who made it, when, from which address, what it was about and how it was answered. A request that was refused is recorded too, since an attempt is what one looks for after a token leaked. This page shows how to read the trail, how to filter it, what an entry says, what is recorded and what is not, and how long it is kept.
Before you begin
- Reading the trail needs the
adminrole. See Create tokens for CI and teammates. - The agent is 0.6 or later. An older one answers
the agent is older than this shipwick and keeps no audit trail. The trail starts with the first change made after the upgrade; nothing from before is in it.
Read the trail
shipwick auditWHEN WHO ACTION ON RESULT FROM DETAIL
2026-10-03 20:20:44 root secret.set DB_PASSWORD ok 203.0.113.9
2026-10-03 20:20:22 ci deploy web refused 203.0.113.40
2026-10-03 20:20:17 ci deploy my-api ok 203.0.113.40 deployment 2
2026-10-03 20:20:06 root token.create ci ok 203.0.113.9 role deploy, limited to my-api, expires 2027-01-01T17:20:06ZThe last 50 entries, newest first, with times in your machine's time zone. Here the token ci, limited to my-api, deployed it, and was refused when it tried web.
| Column | |
|---|---|
WHO | The token's name, root for the agent's own, or the e-mail address of a person who signed in. |
ACTION | What was asked for: deploy, rollback, stop, secret.set, token.create, backup.restore and so on. The full list is in the API reference. |
ON | The application, and what else the request named: the job, the volume, the backup's id, the secret, the registry, the hostname of a certificate, the token. server for what is about neither. |
RESULT | ok: the request was accepted. refused: the role or the application limit did not allow it. failed: <code>: anything else, with the error's code. |
FROM | The address the request came from. |
DETAIL | What was started — deployment 12, run 4, backup 7 — or what was asked for: a created token's role, applications and expiry. |
ok means the request was accepted. How a deployment then went is in its own record, which the detail names: shipwick status and the dashboard's history show it.
Filter it
shipwick audit --app my-api --since 7d
shipwick audit --actor ci -n 200| Flag | |
|---|---|
--app <name> | Only what was done to this application. |
--actor <name> | Only what this token, or this person, did. |
--since | How far back: days or hours (7d, 24h) or a date (2026-09-01). |
-n, --lines | How many entries, newest first. 50 unless you say otherwise, at most 500. |
--before <id> | Continue with the entries older than the one with this id. |
When a page comes back full, the last line is the command that continues it:
Older entries: shipwick audit --app my-api --before 4812Nothing found reads Nothing recorded that matches.
What is recorded
- Deployments, redeployments and rollbacks, stops and starts, deletions.
- Commands and jobs started by hand, uploaded images and folders.
- Secrets set and removed, by name and never by value; registry logins and logouts; certificates.
- Tokens created and revoked, key rotation.
- Backups taken, verified, restored, removed, downloaded and adopted; volume downloads, restores and removals.
- Exports, imports and promotions.
- Sign-ins, the refused ones too, sign-outs, and every change to the access rules.
Not recorded:
- Reading. Listing applications or following logs leaves no entry. The two exceptions hand out an application's data: downloading a volume's archive, and a backup's.
- What the agent does by itself: scheduled backups, jobs and exports, restarts by the supervisor. Those are in the application's events.
- A request without a valid token. It has no name to record; it is in the agent's log, and counted by the limit on failed attempts.
Nothing from a request's body is kept except names: no env, no secret's value, no command, no passphrase.
Where a request came from
Behind the proxy the address is the one Caddy saw the request come from. For an agent hostname behind Cloudflare's proxy that is Cloudflare's address. On a direct connection, such as an SSH tunnel, it is that connection's.
For what is done in the dashboard, the dashboard's server passes the browser's address on, so the trail names who asked and not the dashboard.
The API keeps both: address, where the connection came from, and forwarded_for, the client address the proxy reported. On a connection that does not come through the proxy the second is the caller's own word, which is why both are kept.
How long it is kept
A year, and at most 100,000 entries, whichever is reached first. The trail lives in the agent's database and travels with its backups. An export does not take it along: it describes the old server.
In the dashboard
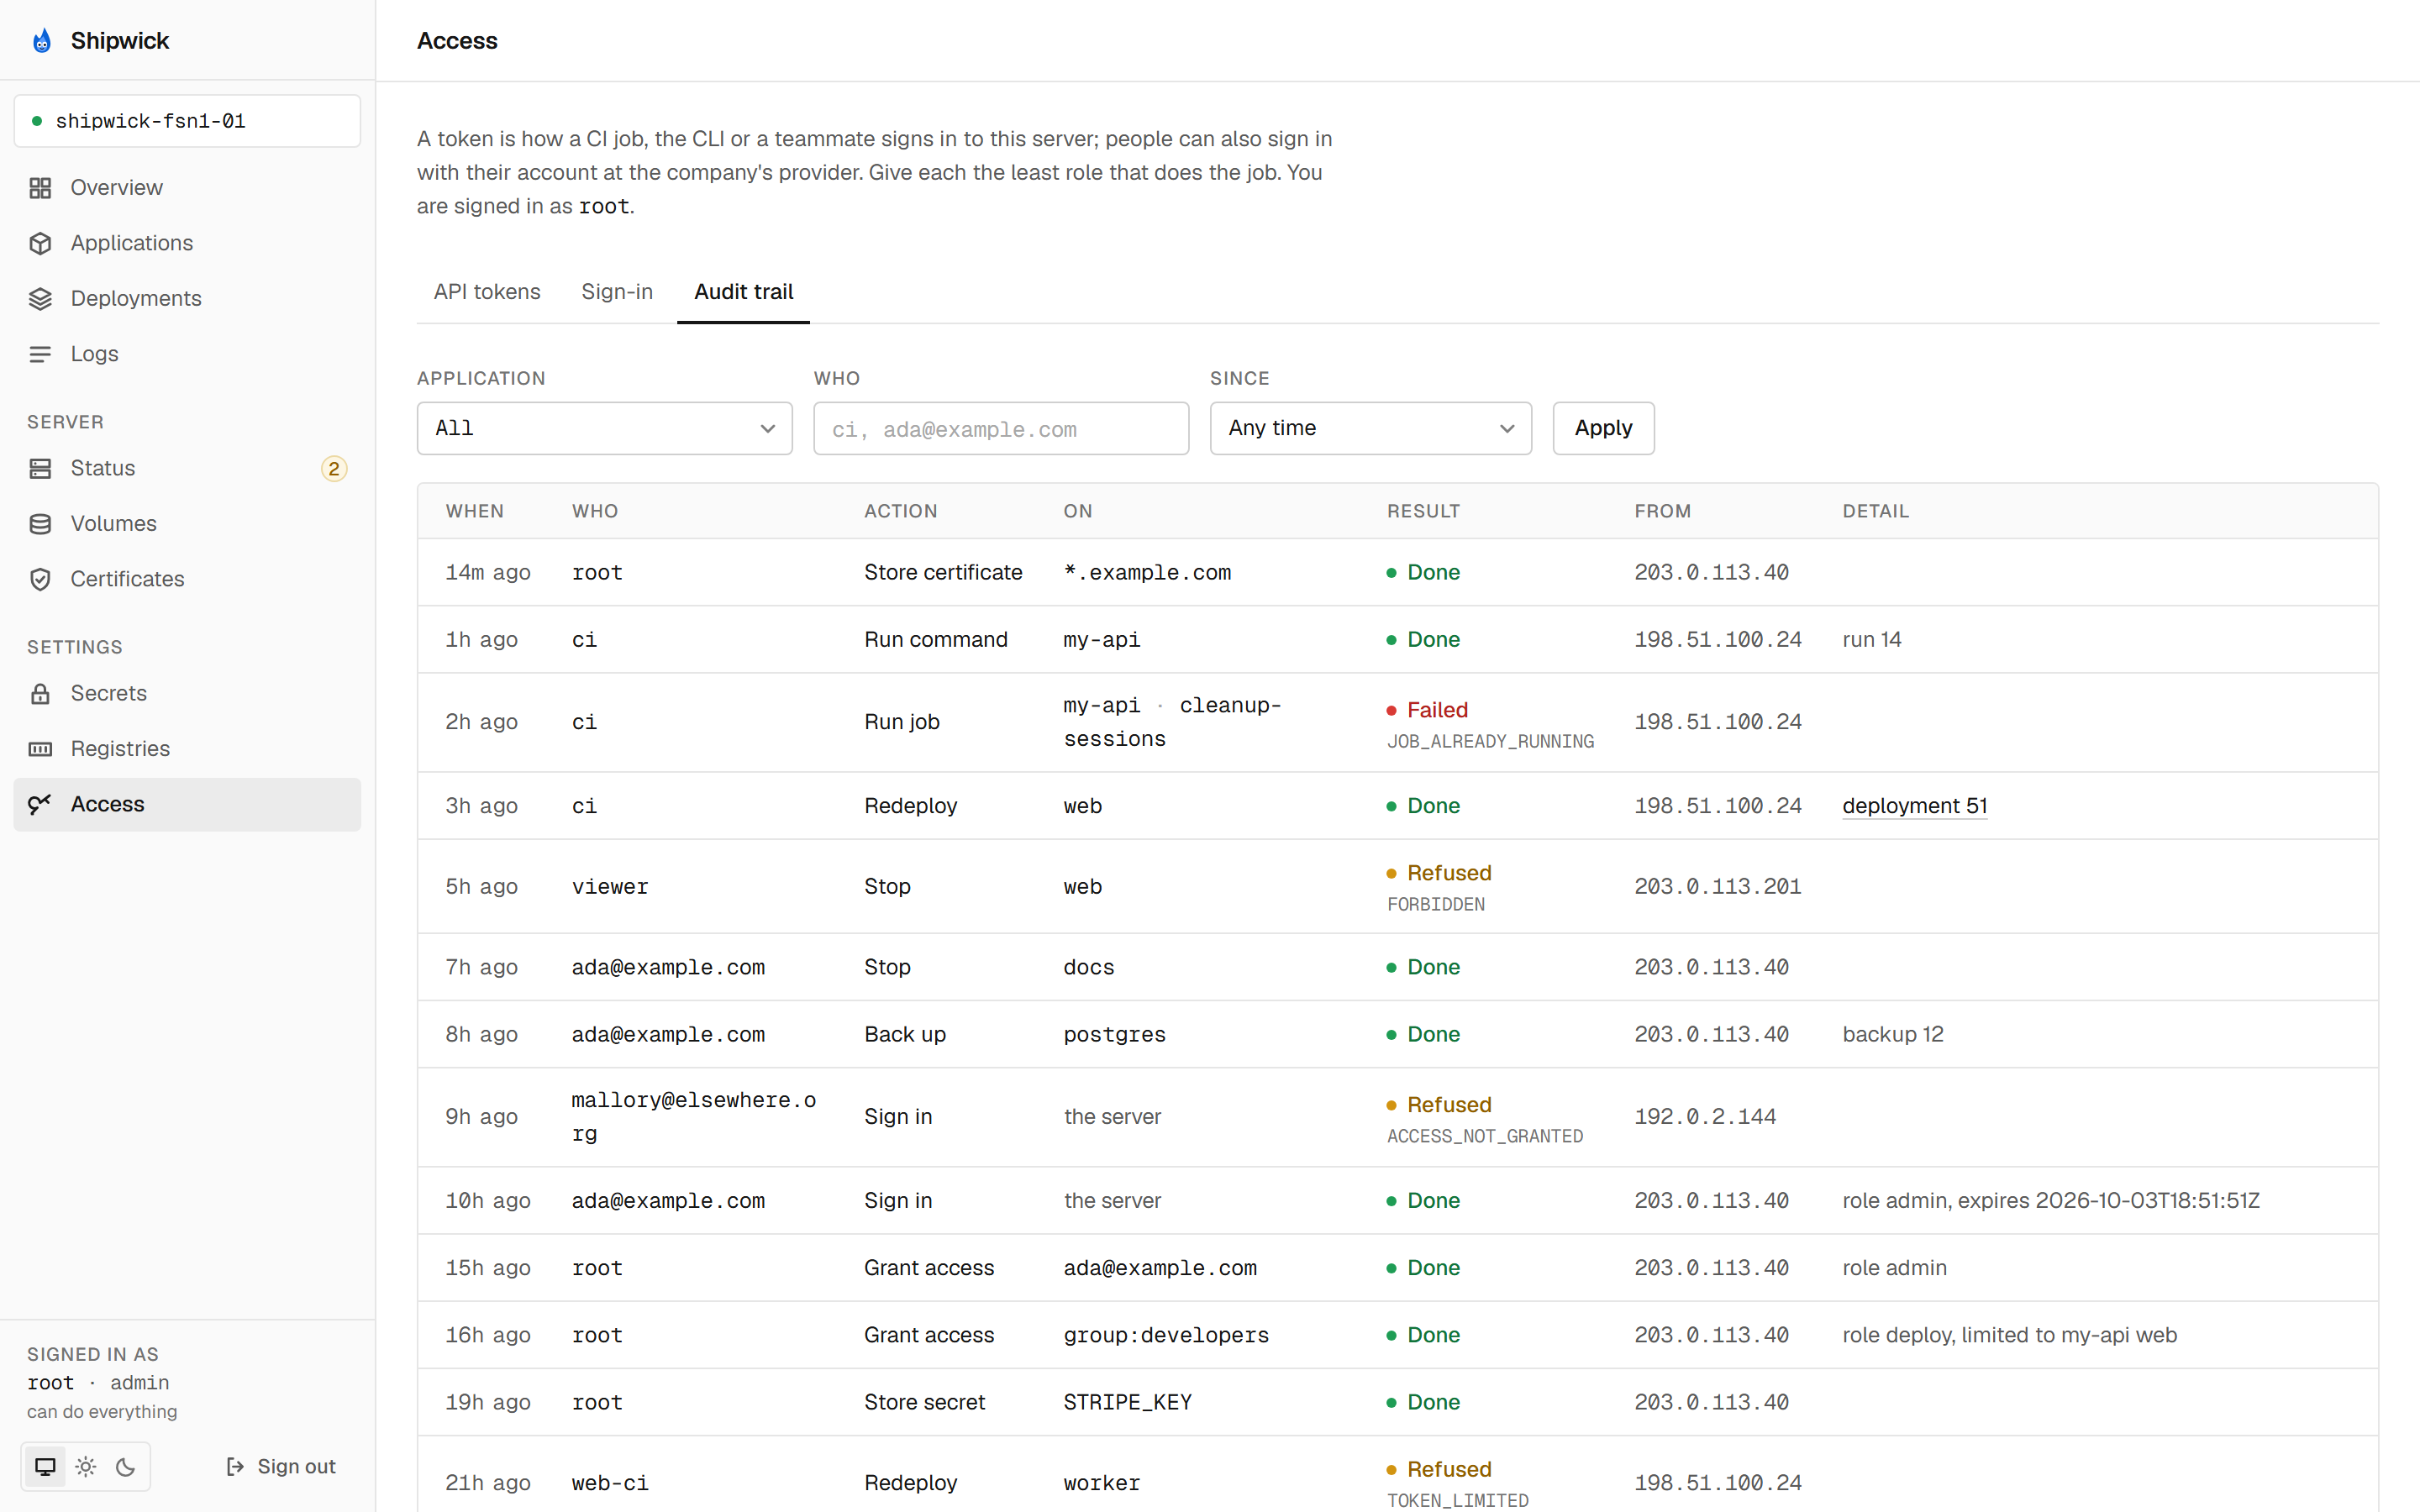
Under Access, the Audit trail tab shows the same, filtered by application, name and time, with Load older while a page comes back full. An entry that started a deployment links to it.
From a script
curl -H "Authorization: Bearer $SHIPWICK_AGENT_TOKEN" \
  "https://agent.example.com/api/v1/audit?application=my-api&since=7d&limit=100"
GET /audit takes application, actor, since, limit and before, all optional, and needs admin. See the API reference.
What's next
- Create tokens for CI and teammates: a name per pipeline and per person is what makes the trail readable.
- Sign in with your company's accounts: then the trail names people.
shipwick auditin the CLI reference.- Security.